
Recently, I was assigned to a project where we needed to build a graph with some pretty lofty specs. D3 is often considered the best graphing library for frontend developers, but on a cursory glance, the documentation was a bit unclear and seemed denser than I had time to parse, given the scope and timeframe allotted. I shopped around for other graphing libraries and came across Recharts, a React-specific graphing library built on top of D3 that had been used more frequently and had a better rating than Nivo, Victory, or react-vis.
While I know good documentation for D3 exists and there are widespread use cases of it in the wild, Recharts piqued my interest. The website for it was snappy and clean, the documentation seemed pretty robust, there were a good number of customizable props, and it followed the same pattern of importing components and giving them prop values, which would reduce the amount of time I’d have to spend bootstrapping. So Recharts was the winner.
The Project
The client for this project gave us the following specs:
-
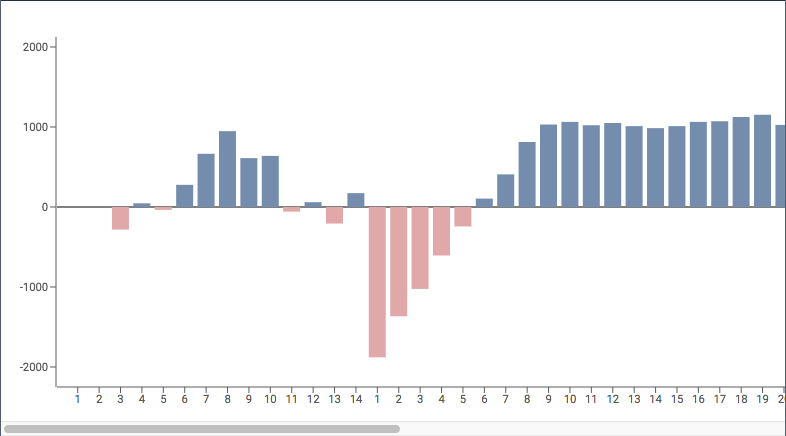
The graph is a bar chart that can display both positive and negative values with the domain limited to -2000 to +2000.
-
Bars with positive values should be blue, and bars with negative values should be red.
-
Bars should be selectable.
-
When a bar is selected, it is a slightly darker color, and a tooltip should appear over it, which displays the bar’s value.
-
If a bar’s value exceeds -2000 or +2000, it remains capped at that height and has a perpetually visible label displaying its actual value.
-
Bars with large values in either the positive or negative direction are a more vibrant blue or red than unselected or selected color.
-
The graph will continually grow to the right, so its container will scroll once it reaches a certain length.
-
The app that utilizes this graph is primarily for use on a tablet through a web browser.
-
The Y-axis should remain static while you're scrolling through the X-axis.
-
The label for the data point counts up incrementally by 1.
-
When the userId changes, i.e. the result is recorded by User B rather than User A, the label for the series starts back at 1 and counts up from there.
And this is what the graph ended up looking like:
The Limitations of Recharts
While using this library to fulfill the requirements, I ran into a few roadblocks:
- The built in
<Tooltip />component for Recharts only works on hover, which isn’t feasible for a tablet. - While you can specify a domain for your graph, the graph does not truncate bar values to fall within the domain. That is to say, if the maximum of the domain was 2000, and the value of a given data point was 2500, the positive side of the axis would automatically scale to 2500.
- The conditional color of the bars could not be handled simply in the component. It required a pure function to calculate the color for the fill of the object.
- Many of the customizable props aren’t documented with examples in Recharts. The solutions I came up with to meet the specs were based on reading the Github Issues for the library’s repository, or looking at third-party examples on CodePen and jsFiddle.
- The Y-axis component has no "static" property. If you scroll along the X-axis, the Y-axis will eventually scroll out of view
So How Did I Do It?
Transforming the data
In a perfect world, the data from the backend would come in exactly the correct shape to be easily consumed by Recharts graph, but alas, it did not. The data started like this:
interface ResultShape {
  readonly resultId: string
  readonly userId: string
  readonly score: number
}

const results = [
  {
    resultId: "22f0-23as9-9adf-98sfd",
    userId: "user1",
    score: 1000,
  },
  {
    resultId: "18q0-23as3-9adq-98sq",
    userId: "user1",
    score: -200,
  },
  {
    resultId: "9748-2737-1747-7759",
    userId: "user2",
    score: 1500,
  },
]
And using this function:
interface Coordinate {
  readonly label: string
  readonly value: number
}

export const convertTablesResultsToGraph = (
  results: ReadonlyArray<ResultShape>,
): ReadonlyArray<Coordinate> => {
  // create an ordered sort array of userIds
  const userIds = results.map((r) => r.userId)
  const sortOrderOfUserIds = [...new Set([...userIds])]
  // make a basemap of all results by userId
  const basemap = results.reduce(
    (acc, next): BaseMap<ReadonlyArray<Coordinate>> => {
      const id = next.userId
      const contents = !!acc[id] ? [...acc[id], next] : [next]

      const toReturn = {
        ...acc,
        [id]: contents,
      }

      return toReturn
    },
    {},
  )

  // convert this to an array of arrays.
  const basemaps: ReadonlyArray<ReadonlyArray<ResultShape>> =
    sortOrderOfUserIds.map((id) => basemap[id])
  const coordinates: ReadonlyArray<Coordinate> = basemaps
    .map((rounds) => {
      const cc: ReadonlyArray<Coordinate> = rounds.map((item, i) => {
        const { score } = item

        return {
          label: `${i + 1}`,
          value: score,
        }
      })
      return cc
    })
    .reduce((acc, next) => acc.concat(next), [])
  return coordinates
}
It became this:
const coordinates = [
  { label: "1", value: 2500 },
  { label: "2", value: 100 },
  { label: "3", value: -1200 },
  { label: "4", value: -4000 },
  { label: "5", value: 1500 },
]
Selecting a bar
Browsing the examples in the Recharts documentation, I came across this jsFiddle, which demonstrated to me that you can use the component’s local state to track the index of the selected bar. It ended up looking like this:
interface ResultGraphState {
    readonly selectedIndex: number | null
}

...
constructor(props: ResultGraphProps) {
    super(props)

    this.state: ResultGraphState = {
        selectedIndex: null
    }
}

...
It also demonstrated a way to make the fill of the bar change color conditionally, using the <Cell /> component. In the example, they use a ternary, but in my case, I needed a function which could output six different colors.
Note: we keep all of our colors in an appColors object as hexcode strings.
export const colorSelector = (
  value: number,
  trueValue: number,
  index: number,
  selectedIndex: number | null,
): string => {
  if (trueValue >= 2000) {
    return appColors.modalPositiveLargeValue
  }
  if (trueValue <= -2000) {
    return appColors.modalNegativeLargeValue
  }
  if (index !== selectedIndex) {
    return value > 0
      ? appColors.modalPositiveGraphValue
      : appColors.modalNegativeGraphValue
  }

  return value > 0
    ? appColors.modalPositiveGraphValueSelected
    : appColors.modalNegativeGraphValueSelected
}
I spun up the click functionality for toggling the selection of the bar in a class method and passed it into the <Bar /> component as shown in the jsFiddle.
Creating and rendering a custom tooltip
The first thing I needed for this part was a custom tooltip, which I built using styled-components and this CSS generator as a resource for giving the tooltip its signature pointy bit.
const CustomTooltip = styled.div`
    display: flex;
    justify-content: center;
    align-items: center;
    ${({ isPositive }: DisplayProps) => !isPositive && "margin-top: 10px;"}

    .tooltip-body {
        width: 100%;
        position: relative;
        background: ${appColors.tableDataOverviewBackground};
        border: 1px solid ${appColors.tableLabelText};
        text-align: center;
        padding: 1px 3px;
        border-radius: 2px;

        &:after {
            content: "";
            position: absolute;
            left: 50%;
            width: 0;
            height: 0;
            border: 10px solid transparent;
            margin-left: -10px;
            ${({ isPositive }: DisplayProps) =>
                isPositive
                    ? `bottom: 0;
            border-top-color: ${appColors.tableLabelText};
            border-bottom: 0;
            margin-bottom: -10px;`
                    : `top: 0;
            border-bottom-color: ${appColors.tableLabelText};
            border-top: 0;
            margin-top: -10px;`}
        }

        p {
            font-size: 0.75em;
            color: ${appColors.tableLabelText};
            margin: 0;
            align-self: center;
        }
    }
`
I probably could have used the blueprintjs library for the tooltip component, but I ended up making my own to ensure that it would be lightweight and not contain any additional animations or properties I didn't need. The app was already calculating a data transform on a large swath of data, and keeping the graph performant was a key part of the feature.
Originally, I tossed the tooltip inside of the <Bar> component tags and found out the hard way that you can’t just shoehorn a non-Recharts component as a child to a Recharts component, especially given that the whole Recharts graph is actually an SVG. I tried to find a premade tooltip SVG that was free to use, but didn't see anything that really matched the mockups or seemed easy to implement.
Upon digging through the documentation, I came across the <LabelList />component, which thankfully can take a React element as a content prop, and even came with another handy jsFiddle.
This jsFiddle shows that the function that creates the customized label receives props from the parent <LabelList /> component, which contains the x and y coordinates of where the bar sits relative to the SVG, the width and height of the bar, and the data’s value. From there, I could place the tooltip and feed it the correct data.
The only problem was trying to render the div. It wasn’t showing up, but I knew that something was being rendered based on what was happening in the Chrome dev tools tab. So I started looking into an element called <foreignObject>, which through some magic allows HTML to be nested inside an SVG tag. I added conditional rendering for selected vs. non-selected index with my selectedIndex from state, fed the component, and ended up with this:
Rendering the true value of a truncated bar
Initially, I was stumped by this problem, until I remembered that the graph coordinate objects didn't have to just be an "X" and "Y" value. The coordinate could any shape that I needed it to be, as long as I specified the dataKey prop in the library components.
I ended up updating the coordinate shape from this:
interface Coordinate {
  readonly label: string
  readonly value: number
}
to this:
interface Coordinate {
  readonly label: string
  readonly displayedValue: number
  readonly trueValue: number
}
and updated my data transform utility like so:
export const convertTablesResultsToGraph = (
    results: ReadonlyArray<ResultShape>,
): ReadonlyArray<Coordinate> => {
    ...

    const coordinates: ReadonlyArray<Coordinate> = basemaps
        .map(rounds => {
            const cc: ReadonlyArray<Coordinate> = rounds.map(
                (item, i) => {
                    const { score } = item

                    const isLargeValue = isValueTooLarge(
                        score,
                        2000,
                    )
                    const displayedValue = calculateDisplayValue(
                        score,
                        isLargeValue,
                        2000,
                    )

                    return {
                        label: `${i + 1}`,
                        displayedValue,
                        trueValue: score,
                    }
                },
            )
            return cc
        })
        .reduce((acc, next) => acc.concat(next), [])
    return coordinates
}
...
Using the updated data transformation utility, I was able to write an additional <LabelList> component to track the "true" value of the coordinate while maintaining its height at the very maximum of the graph's domain, which ended up looking like this:
Creating a static Y Axis
I will be the first to admit that this is the hackiest part of the whole process. But it performs well, and it looks pretty good, if I do say so myself.
I opened the modal containing my graph, opened the dev tools, and straight up copy-pasted the whole <g> group of lines that made up the Y-axis, the Y-axis labels, and all of the ticks into a new functional component, which looked something like this (with the bulk of it omitted because visual clutter):
export const CustomYAxis = (): JSX.Element => {
  return (
    <div className="y-axis-wrapper">
      <SVG width="56" height="360" viewBox="5 0 56 420">
        <g className="recharts-layer recharts-cartesian-axis recharts-yAxis yAxis">
          ...
        </g>
      </SVG>
    </div>
  )
}
The SVG props for width, height, and viewBox were copied from the whole Recharts graph, and then modified to trim as much whitespace as possible. In order to maintain the same sizing and scale, I didn't delete the original <YAxis> from the graph. I just gave it the property hide={true}.
The whole render method for the graph ended up looking like this:
return (
  <div className="graph-wrapper">
    <CustomYAxis />
    <BarChart {...props}>...</BarChart>
  </div>
)
and the CSS (styled from the parent component) looked like this:
> div > .graph-wrapper {
  display: flex;
  flex-direction: row;
  padding-top: 1em;
  max-height: 435px;
  overflow-x: scroll;
  overflow-y: hidden;

  > .y-axis-wrapper {
    background: white;
    position: sticky;
    left: 0;
    z-index: 1003;
  }
}
The result?
Conclusion
In general, I'd say that while Recharts lacked a lot of features I needed to fulfill the specs of my project, it's still a good entry-level graphing library. The animations are super smooth (though I turned them off to prevent any potential lag), and there are a lot of component props to customize the graph that I'd be interested in exploring in future projects.
The most important, and the most fun part, was getting the chance to flex my problem-solving skills. I enjoyed having the opportunity to come up with ways around the limitations I encountered, and I hope that the documentation of my process helps other people running into problems with Recharts or helps the devs improve the library in the next version.
Anything I missed in my analysis or could've done better? Feel free to reach out in the comments!